
As with education in general, our ability to respond to COVID-19 in education depends significantly on access to resources by students and teachers. Even in this moment of crisis, governments should inform their decisions regarding education and educational resources on the available data whenever possible. However, we realise that accessing relevant data is not necessarily straightforward and this should not block other elements of system response-recovery-reform.
Crucial data relating to education include:
- Government’s COVID-19 policy response. What are the measures taken by the government to address COVID-19? Are all schools closed yet? Are they closed in all areas? Is there a strict lockdown? If not, will there be in the near future? How long do they plan to be closed for?
- The population’s device and internet availability rates. This data is typically available from network providers/operators, Ministries of ICT or governmental telecom regulators. Such data includes:
- internet availability
- device availability (e.g., laptops, smartphones, basic phones, radios, TVs)
- geography of device and internet availability rates
- device availability according to education level and/or socio-economic status
- What infrastructure is already in place that might support remote learning?
- Are there dedicated radio or TV channels for education? Can governments repurpose existing channels for education delivery?
- Does the public education system already have one or more learning management systems in place?
- Are there local governmental and non-governmental institutions with learning content ready for distribution?
- Monitor the ongoing impact of COVID-19 responses. Monitoring responses to dealing with COVID-19, particularly education responses will be crucial. Approaches will need to change based on what’s appropriate to evolving contexts. Current education responses need to be continuously reviewed to ascertain whether they are adequately supporting out-of-school learning. This involves in-depth data gathering, e.g., not just looking at website log-ins, but looking at usage data.
- Monitoring the side effects of school closures. School closures can impact children’s health and social lives as well as education. For example, this World Food Programme map indicates how COVID-19 has disrupted school feeding programmes across the world. School closures can also impact young women, e.g., through increases in domestic violence or teenage pregnancies.
Radar charts on technologies
To help determine the appropriate technology-supported education response, we have devised a radar chart (see Figure 1) which allows policymakers to measure access to five technologies (radio, TV, non-smartphone, smartphone, laptop). The diagram shows additional affordance alongside non-smart phones (SMS, interactive voice), laptops (unmetered internet) and smartphones (mobile internet).
Figure 1: Radar chart on technologies
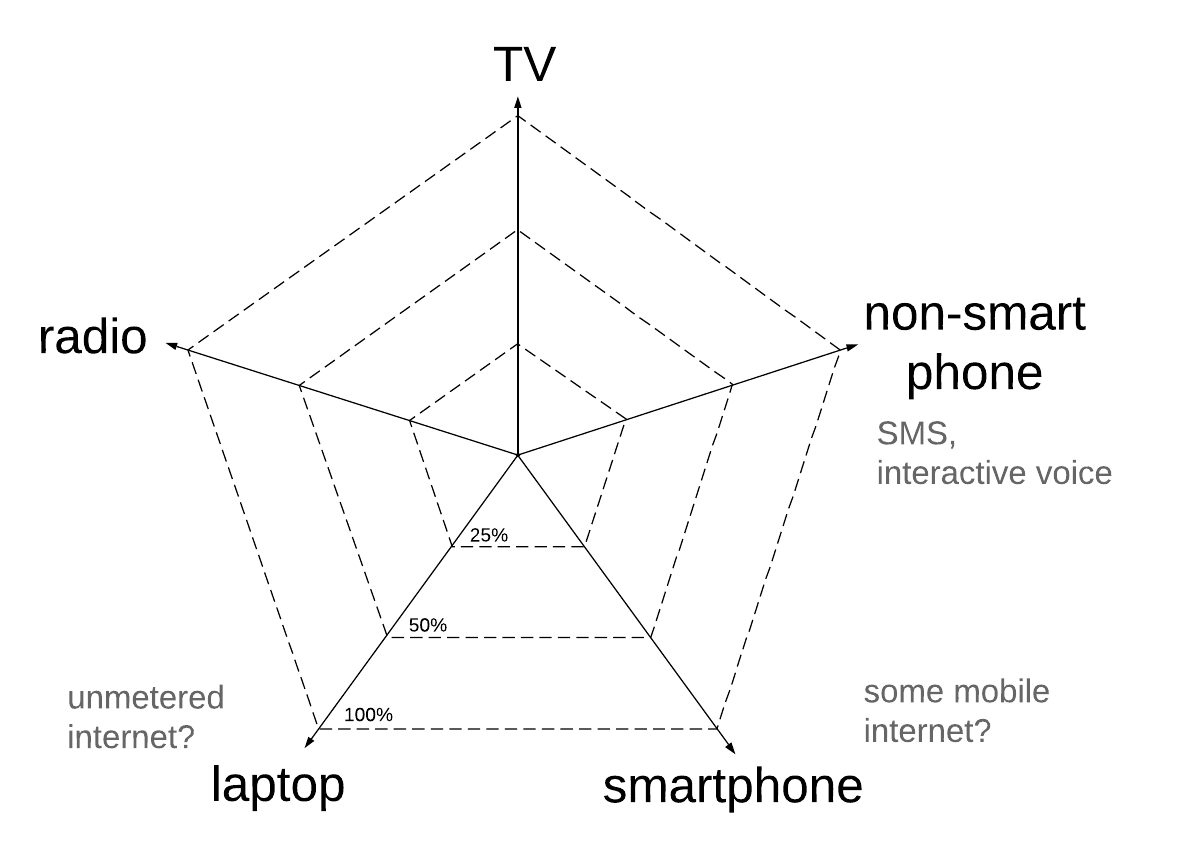
To use this chart, policymakers should estimate the percentage of households in their nation that have access to a device (e.g., radio or a non-smartphone). Bear in mind that this figure will not represent the number of children that may have access to such a device. While a household may have one TV, for example, TV time may be shared between more than one child.
Technologies in high- vs low-income countries
Using the above methodology, Figure 2 compares the values for a high-income country (blue)with the values for a low-income country (orange).
Figure 2: Radar chart on technologies: high- vs. low-income countries
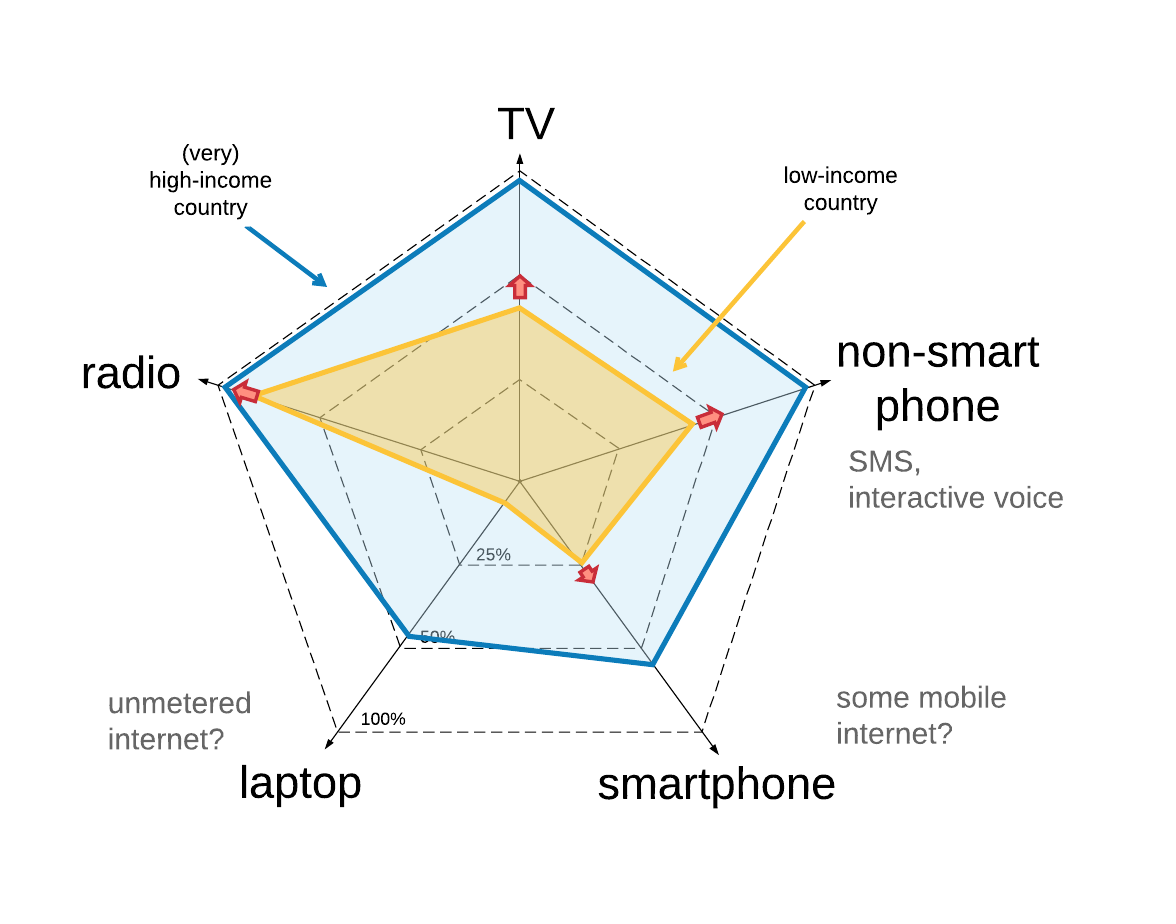
In a high-income country, we expect:
- All households have access to radio and a TV.
- Almost all households own a smartphone (those that do not are typically elderly residents).
- The number of non-smartphones per household may be much higher than one per household. For example, some households may have one non-smartphone per person.
- Less than 100% of households have access to a laptop. Even in the UK, we know that there are households without laptops.
In low-income countries, we expect:
- Many households can access and use radios although this is less than 100% of households.
- A fair number of households have TVs and non-smart phones.
- The number of households with smartphones will be low, and the number of households with laptops will be even lower.
- There will be significant variance between urban and rural areas. Urban areas are likely to be closer to the (very) high-income country curve (in blue). However, rural areas are likely to be closer to (or below) the orange curve
- Even if a household has access to a device, the use of that device may not be shared equally available among household members. Depending on the culture, girls/women or boys may be disadvantaged.
In addition to gathering data on the population’s existing technology, we may ask whether distributing additional technology is feasible. The small red arrows in Figure 2 indicate possible shifts to account for purchasing power in low-income countries. While some improvements (radio, TV, non-smartphones) may be possible, mass acquisition of smartphones or even laptops would appear very unlikely. Earlier work with student teachers in Ghana shows that some students would acquire smartphones if there was a use for them. However, student teachers did not acquire smartphones as they were not used or required in college (in 2015/16). Nevertheless, this does not mean that a smartphone is within each teacher’s economic means. The most likely extension is wider use of existing technologies. In low-income settings, for instance, more students may try to acquire a radio or a non-smart phone while very few people will be able to afford a laptop.
It is unlikely that low- and middle-income countries will be able to supply additional smartphones/laptops and connectivity at short notice to the low-income populations. Non-smartphones and TVs may be available within communities and may be acquired by some. For the lowest-income populations, we propose investigating the distribution of radios and MP3 players. Both radios and MP3 players are available at low-cost (few USD; somewhat lower than even the cheapest non-smartphones). It may be possible to use existing models and, in a second wave, make improvements on those regarding robustness and power supply. For example, wind-up radios have been used in remote locations and some manufacturers have produced wind-up MP3 players as well.
Developing an equitable response
In Figure 3, we consider different populations together in one nation. This radar chart illustrates the mix of technologies used in a specific country. The percentage shown illustrates which percentage of the population has access to a specific technology.
Figure 3: Radar chart on technologies: a layering of populations within one country
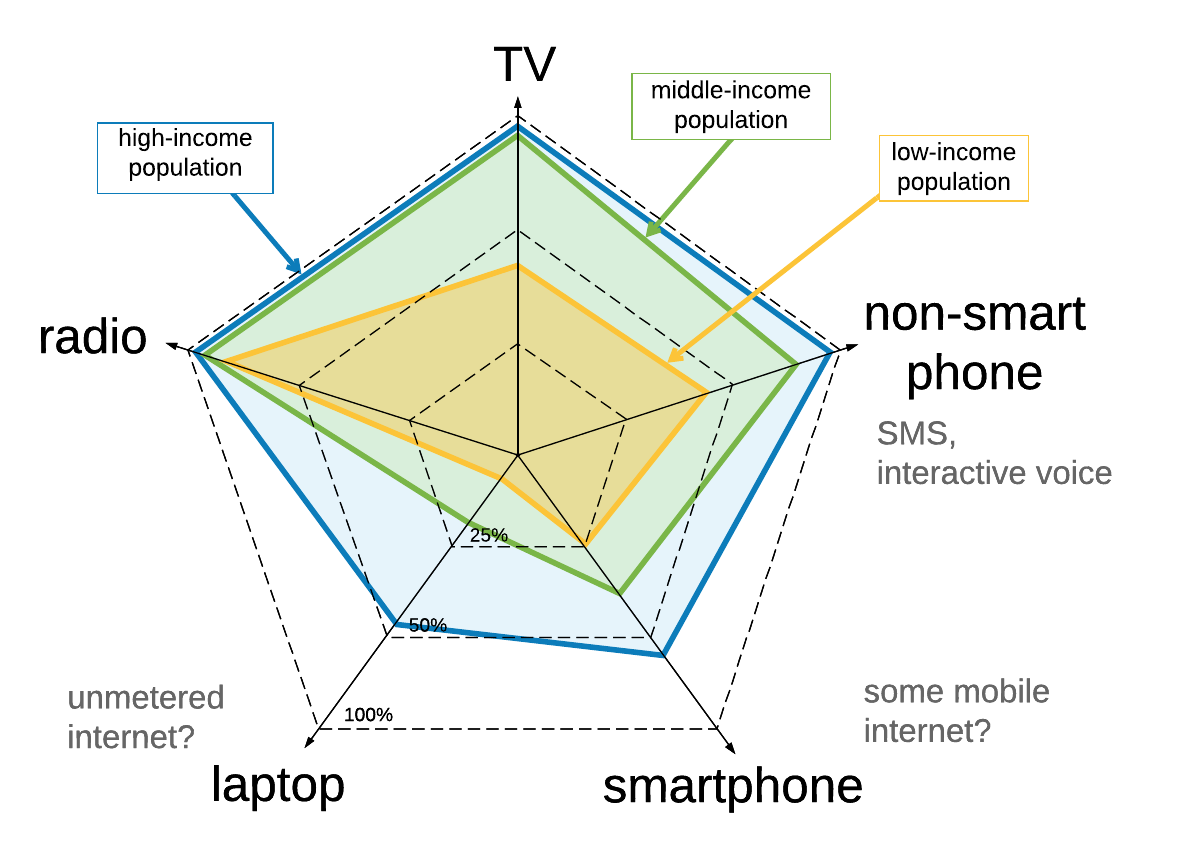
Let’s review what we’ve got so far. We assessed the average affordances of different nations by income (Figure 2). We then overlaid the average technology affordances of different populations (Figure 3). We now look at the distribution of different populations within one country. Figure 4 shows the distribution of populations within three types of countries (high-income, middle-income, low-income) regarding their access to technologies.
Figure 4: Distribution of populations within high-, middle-, and low-income countries
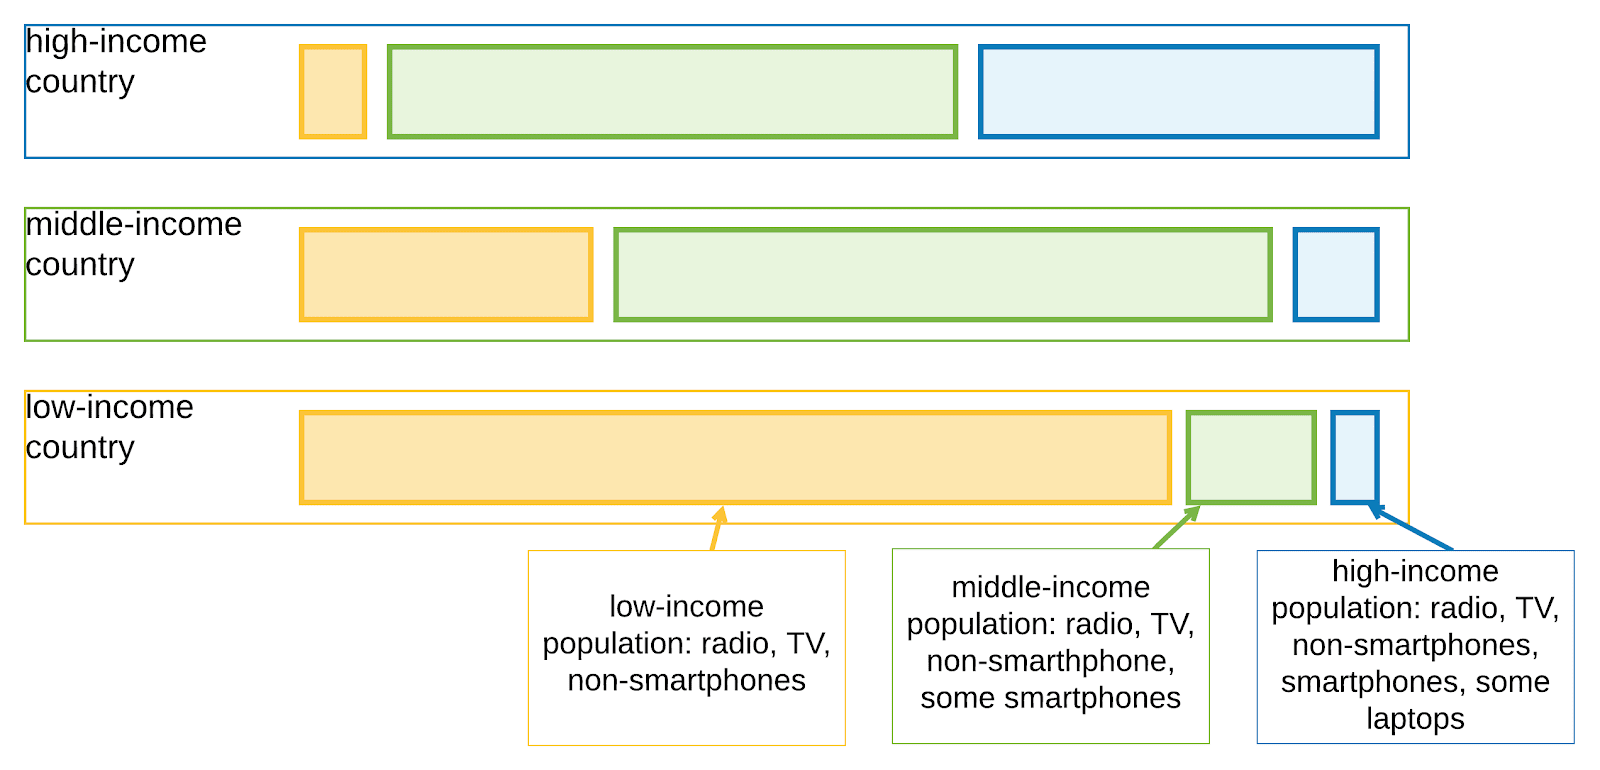
We note that these are idealised scenarios that do not relate to the Human Development Index. They illustrate — in a schematic way — that different populations co-exist. In a high-income country, there is a very small low-income population. In a middle-income country, the majority of the population will be middle-income although there may well be a low-income population of appreciable size. In a low-income country, the majority of the population will be a low-income population. However, there will be some middle-income citizens (e.g., teachers and other professionals) and some high-income citizens. Importantly, the diagram indicates that a response based on smartphones/internet in a low-income country will only reach a small proportion of the population.
In summary, this post has highlighted the need to take full stock of the population’s access to different technologies. A thorough review of technologies used within a country (and which groups use that technology) is necessary to inform which education responses best suit the country. Based on our analyses, we make two main points:
- Responses based on smartphones or the use of the internet will only help a small portion of the population of low-income countries.
- Efforts should be focused on using existing technologies that users are familiar with.
While the immediate response to the pandemic is critical, it should not come at the expense of attempting to mitigate medium- and long-term implications of the crisis. Mass purchasing of new devices should be done with extreme caution as it may deplete resources that are more urgently needed elsewhere or when schools reopen.
